Documentation
Chart configuration
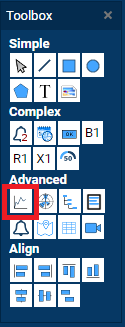
Select Chart Object from TOOLBOX panel and draw it on screen.
Select Chart object and click PROPERTIES menu where are available tree groups of parameter that can change main operations and appearance of the chart in PLAY mode.
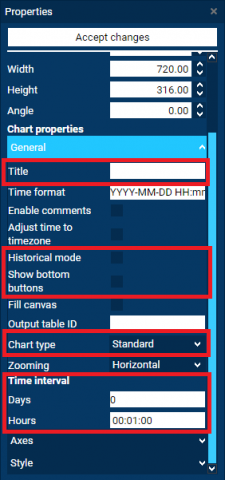
General group – where you have to configure
Title and Time interval of X axis which will be available in PLAY mode. You can choose number of hours, minutes and seconds.
Additional option to select is Historical mode. It turn off automatic refresh of data on chart and allows to view the historical archives.
Our advice for Historical chart is to select one more option Show bottom buttons, it show additional menu below the chart with quick range selector. (will be shown in PLAY mode)
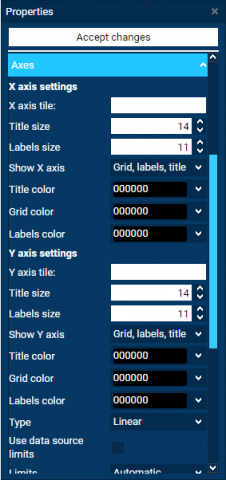
Axes group – where you find the settings of the look of axes, labels, grid and additional auxiliary lines. Parameters can be modify at your own discretion.
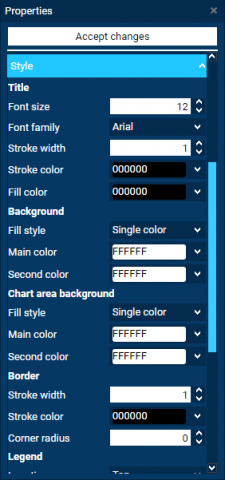
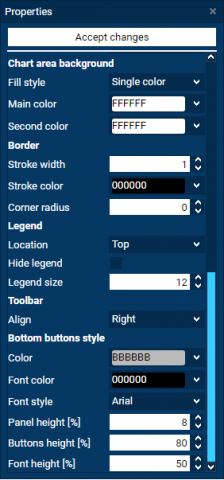
Style group – properties describe the look and size of parameters like Title, Background, Border, Key and Bottom buttons style. Parameters can be modify at your own discretion.
Click button ACCEPT CHANGES to save settings.

